
The Data Table Widget
See Widgets Overview for information about how to add each widget and additional options.
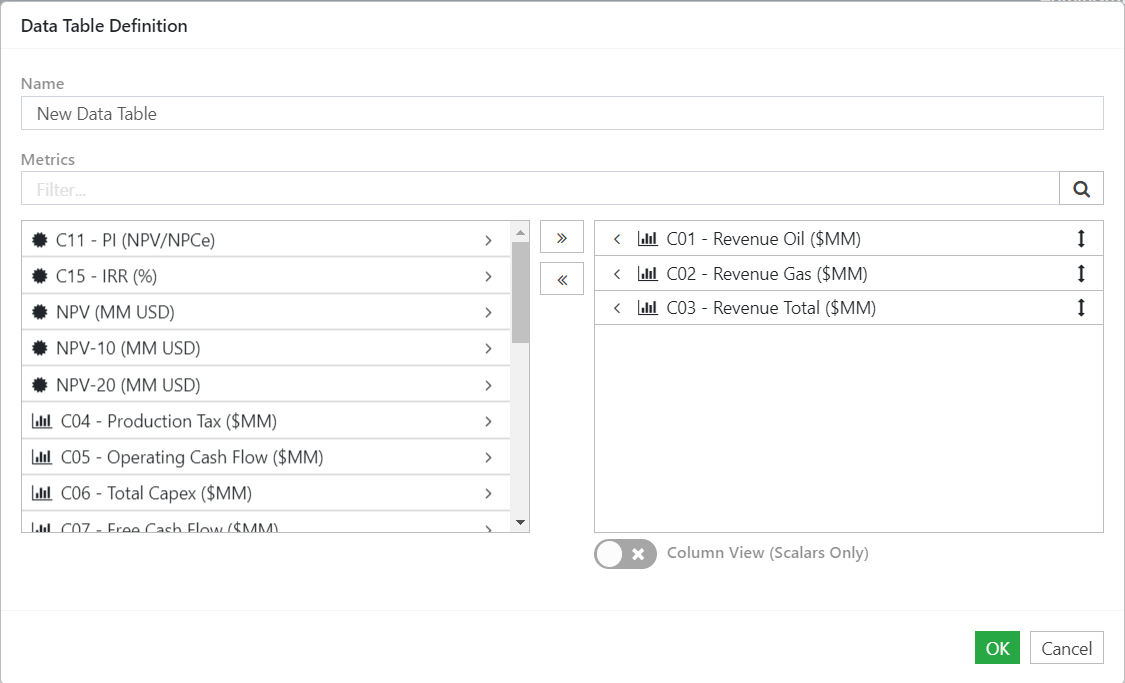
Adding Data Table Widgets to Dashboards
- Set up your table.
- Enter a name for the chart in the Name field.
- Select the indicators and metrics to include in the chart. Click the Add button (
 next to a metric or indicator's name to add it to the chart. Click the Add All button (
 ) to add all of the metrics/indicators to the chart in one step.
 - To reorder the list of included metrics and indicators, click and hold the Reorder icon (
 ) next to the item you wish to move, and then drag and drop it onto a new position in the list.
 - Resize and reposition the widget, as required.
- Click the Save button to save your dashboard.
Click image to expand or minimize.
Export Table Widget Data to Excel
To export the data in a table widget to Excel:
- Hover over the table widget you wish to export, and click the Options icon (
 ).
). - Select Export Table.